Analytics Overview
The Analytics helps you measure the performance of your game and understand how players are interacting with it. You can track key metrics, such as the number of active users, retention rates, and revenue, and use this data to make informed decisions about your game.
- Retention: KPIs that measure how many players return to your game over time.
- Engagement: KPIs that measure how players interact with your game.
- In-World Purchases: KPIs that measure how players spend gold on IWP.
- Owned Rooms: KPIs that measure how many rooms players own.
KPIs stands for Key Performance Indicators. These are metrics that help you understand how well your game is performing.
Accessing the Analytics Dashboard
To access the Analytics Dashboard, follow these steps:
- Navigate to the Creation Tab in the Creator Portal.
- Open the world you want to view analytics for.
- Navigate to the Analytics tab.
Understading Graphs and Metrics
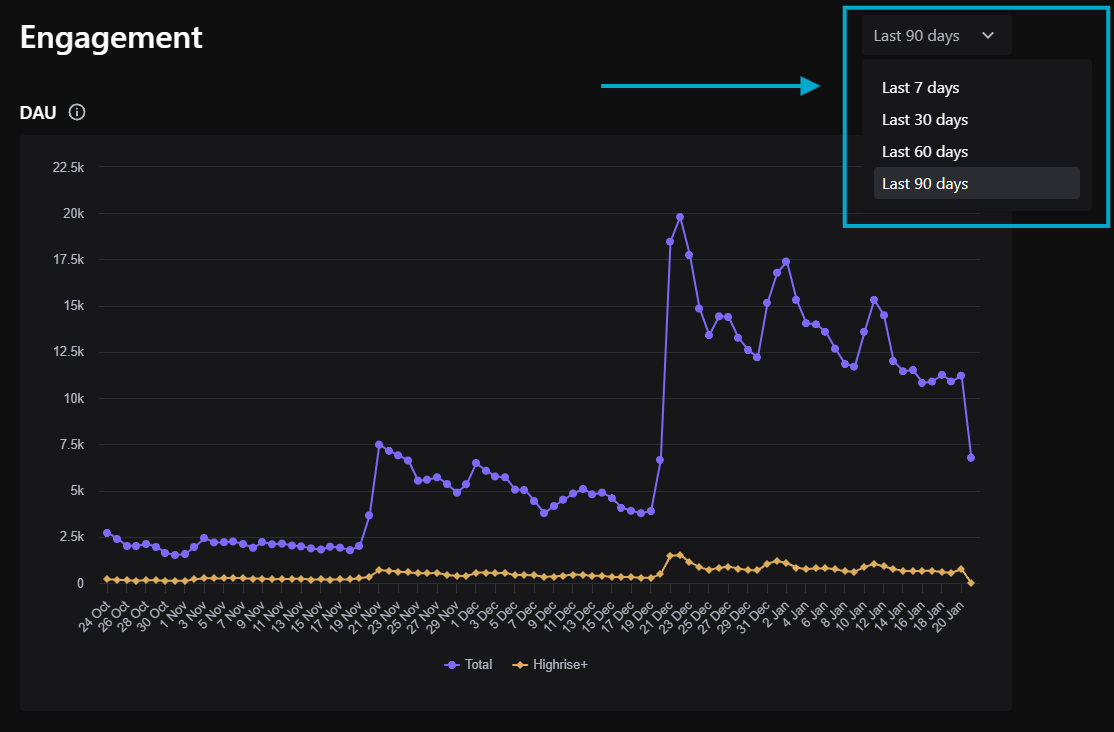
Filter by Date
You can filter the data displayed on the Analytics Dashboard by date. To do this, click the "Last 7 Days" dropdown and select a different date range.
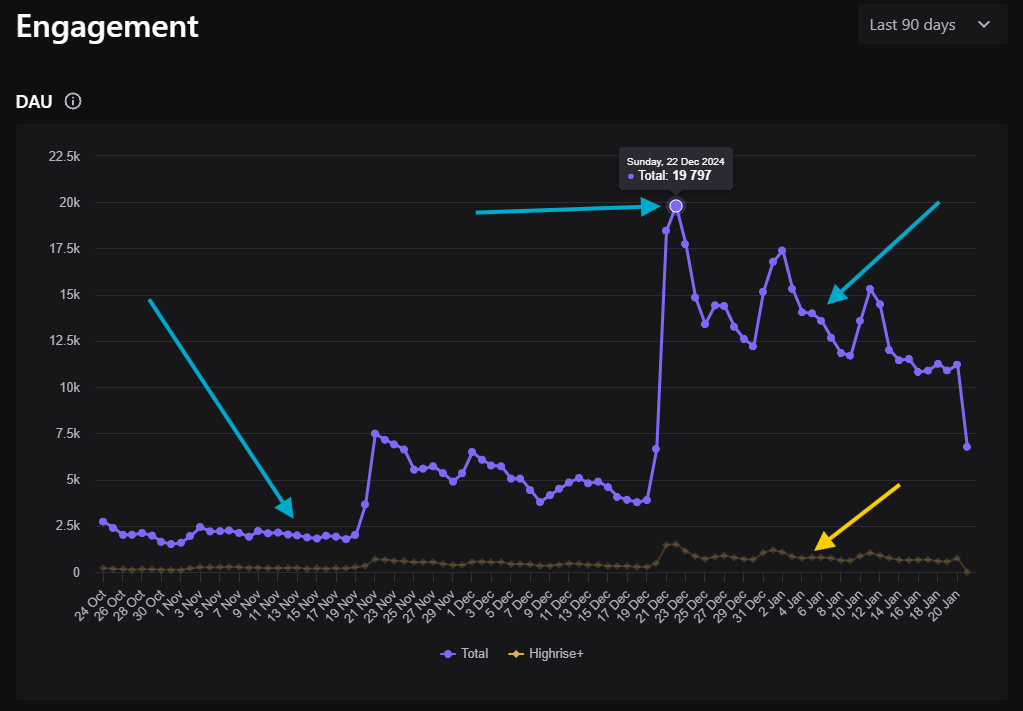
Line Graph
The line graph displays the selected metric over time. You can hover over the graph to see the exact value for a specific date.
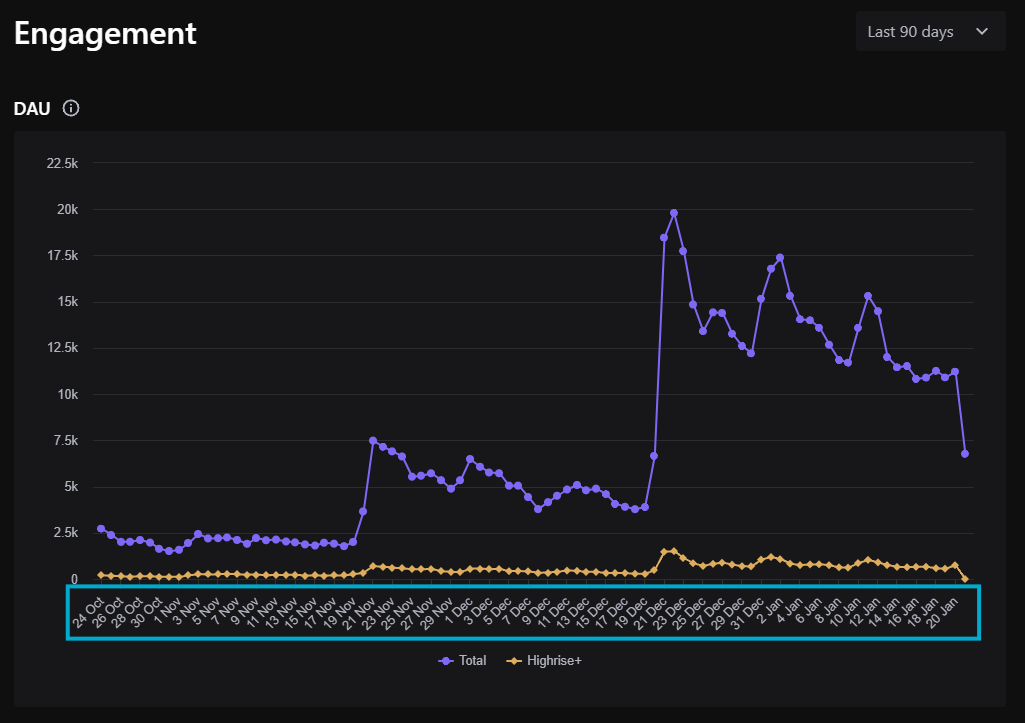
Dates Below the Graph
The horizontal axis, at the bottom of the graph displays dates ranging over the selected time period. Each point on this axis corresponds to a specific day, providing a timeline of the data presented in the graph.
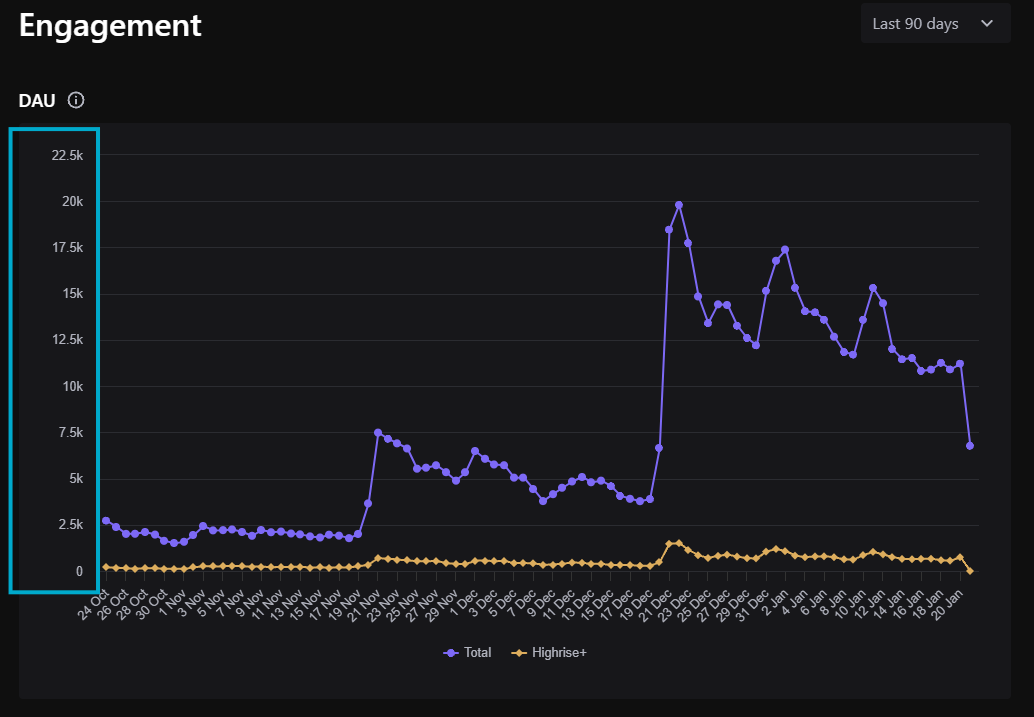
Numbers on the Left Side of the Graph
The vertical axis on the left shows numbers that represent the value of the selected metric. The scale of these numbers changes based on the range of values for the metric.
Conclusion
The Analytics Dashboard provides valuable insights into how players are interacting with your game. By tracking key metrics, you can make informed decisions to improve your game and increase player engagement.

